Available Datasets
This data page is a work in progress, and datasets are available upon request.
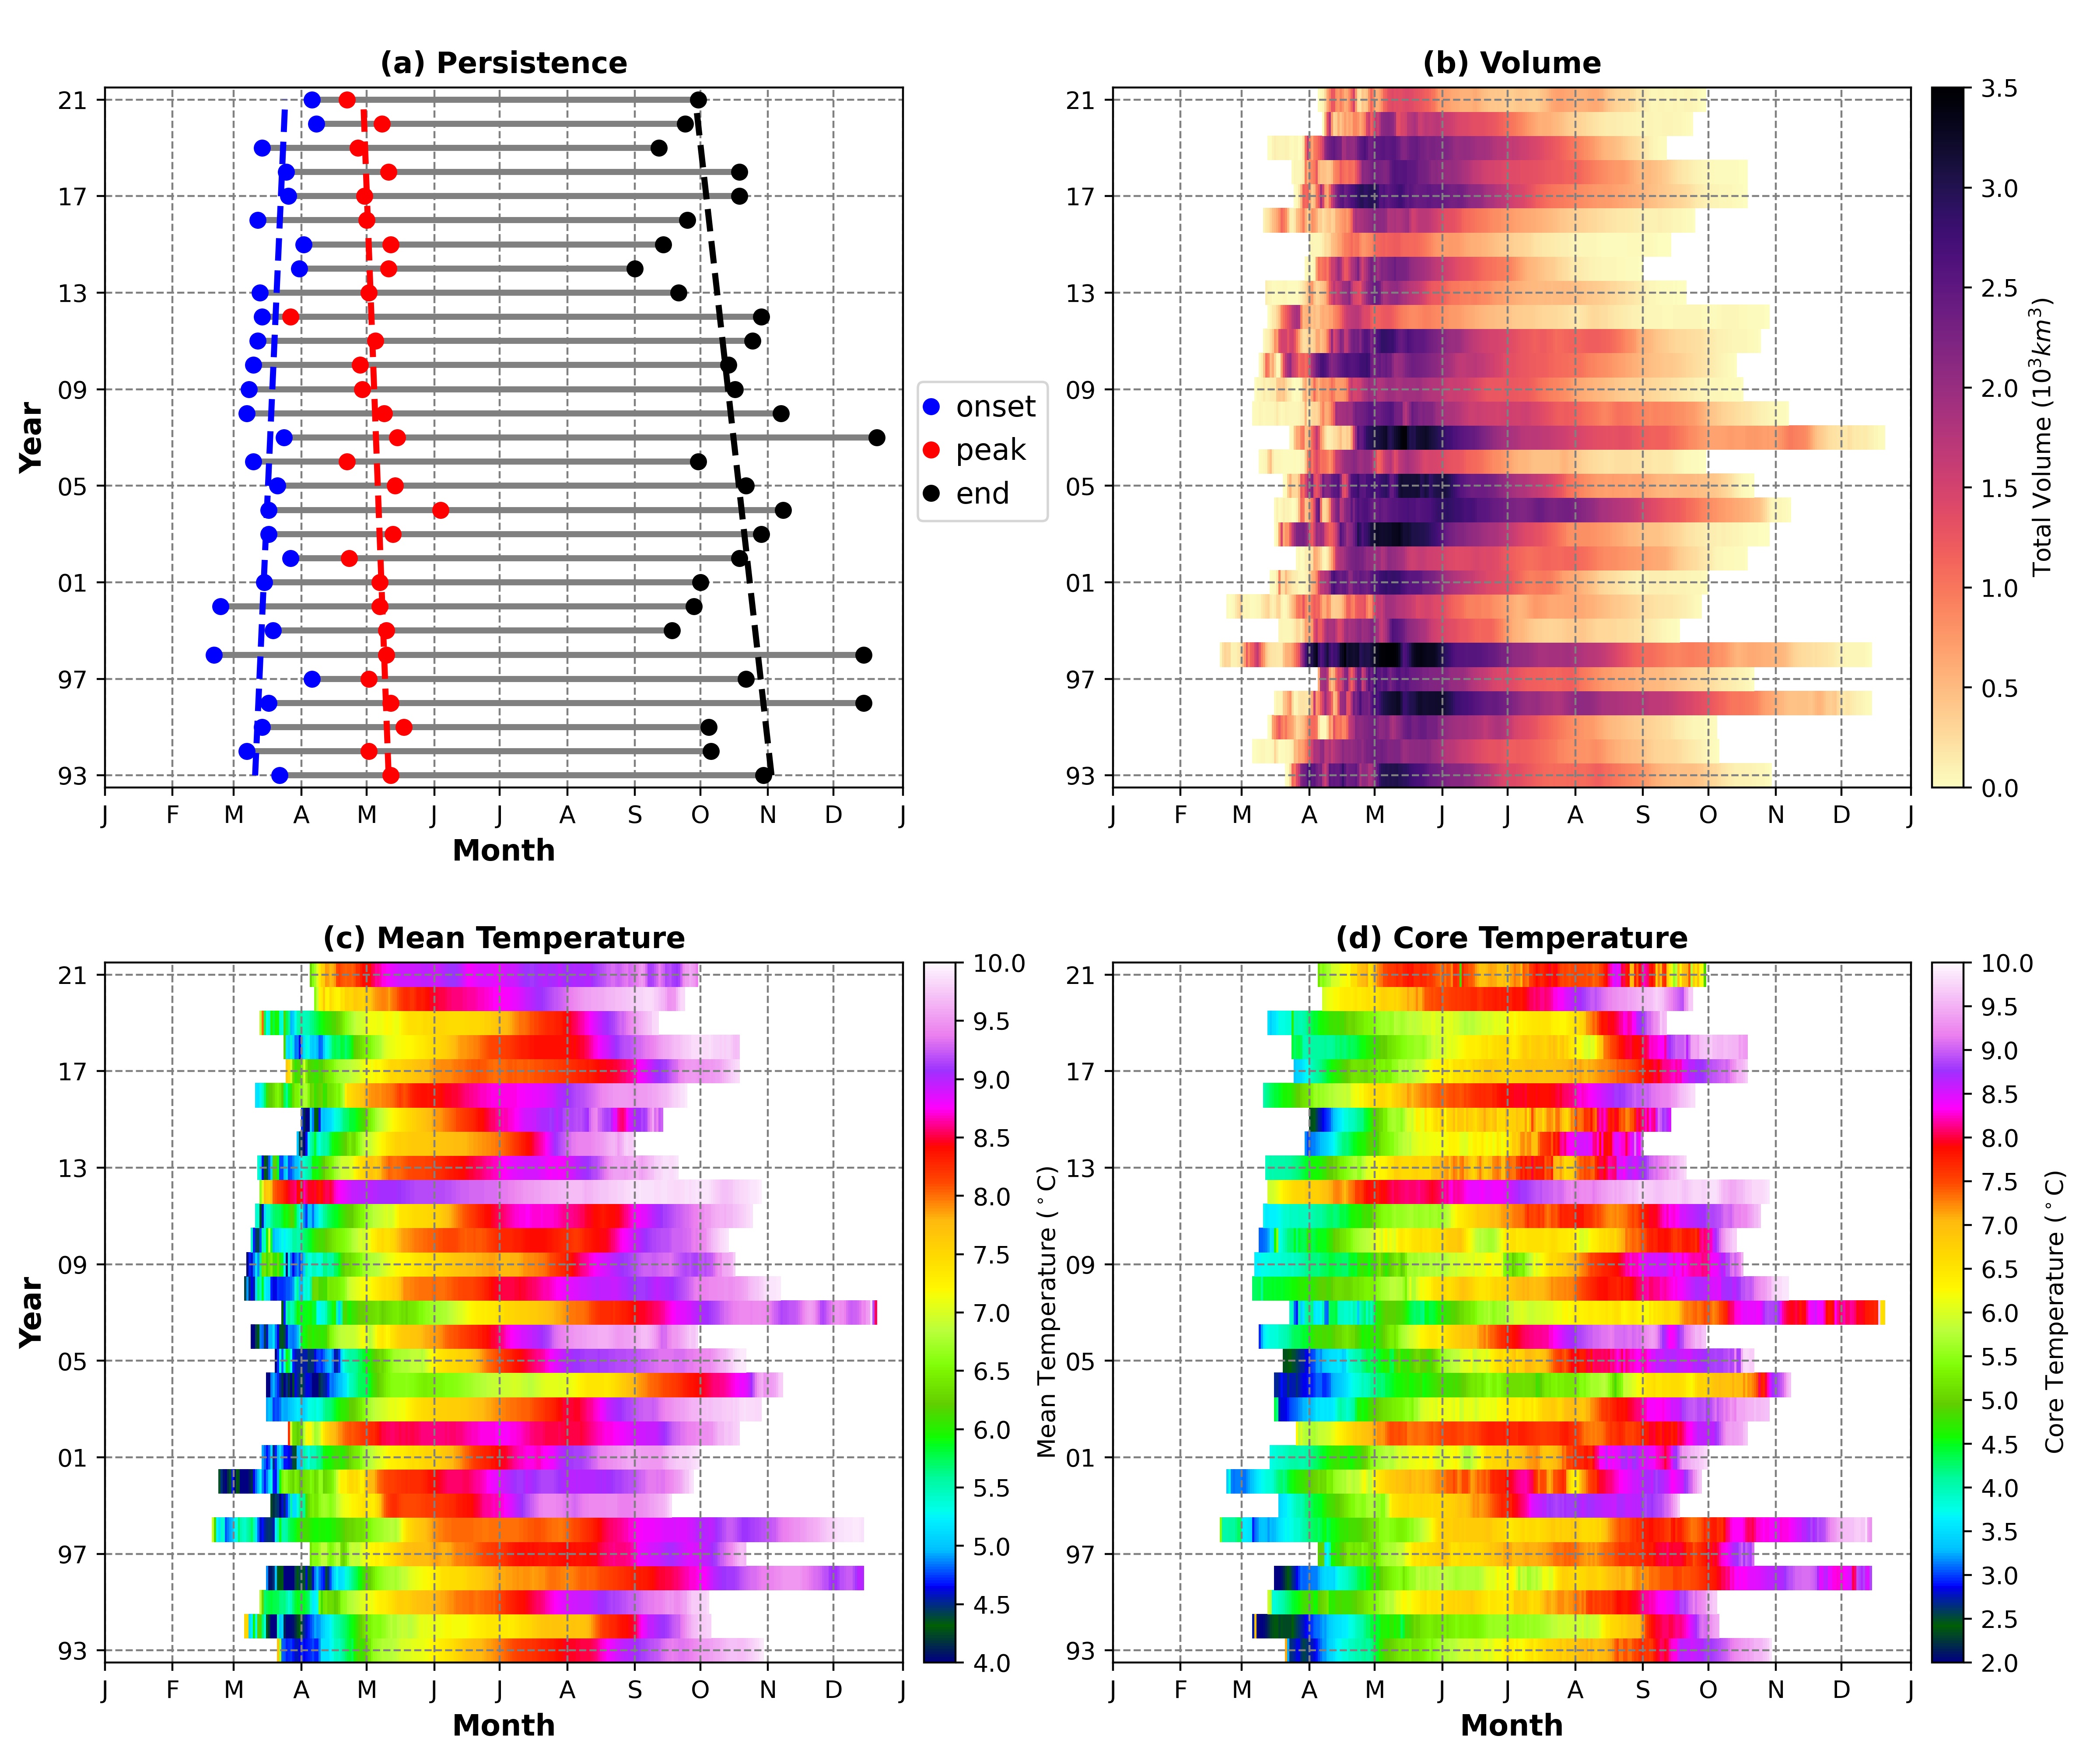
1. The Cold Pool Index based on ROMS-NWA (1958-2007) and GLORYS12v1 (1993-2021)
- The spatial and temporal characteristics (spatial extents, volume, temperature, salinity, etc.) of the Cold Pool are quantified in the numerical model (ROMS-NWA) and GLORYS12v1 reanalysis product.
- The detailed methodology is documented in Seasonal Variability of the Cold Pool over the Mid-Atlantic Bight Continental Shelf and Interannual Variability of the Mid-Atlantic Bight Cold Pool.
2. The SSH-based Gulf Stream Index (GSI), 1993-2021
- The GSI is calculated based on the method presented by Pérez-Hernández and Joyce (2014), which is a simple 16-point GS index constructed by selecting grid points following the maximum Standard deviation of sea level height anomalies every 1.33° longitude between 52° and 72°W and averaging them. The value of 1.33° is based on the resolution of satellite dataset from AVISO.
- We followed the same method, except using the dataset from CMEMS, which has a 0.25°x0.25° resolution. Therefore we select points every 1° between 52° and 72°W and average them, and there are 21 points in total.
- This GSI has been documented in detail in the published paper Seasonal Prediction of Bottom Temperature on the Northeast U.S. Continental Shelf.
3. The T200m-based GSI (or GS North Wall Index), 1954-2021
- This GSI is calculated following Joyce et al. (2009), but with the temperature data from the EN4.2.2 dataset.
- Joyce et al. (2009) smoothed the WOD with a Gaussian taper temporally (0.5 year) and spatially (1.25° in latitude and 2.5° in longitude), therefore it is on seasonal time scale.
- This GSI using gridded EN4.2.2 does not require a Gaussian taper for temporal smoothing, thus the resulting index is monthly.
- This GSI has been documented in detail in the published paper Seasonal Prediction of Bottom Temperature on the Northeast U.S. Continental Shelf.
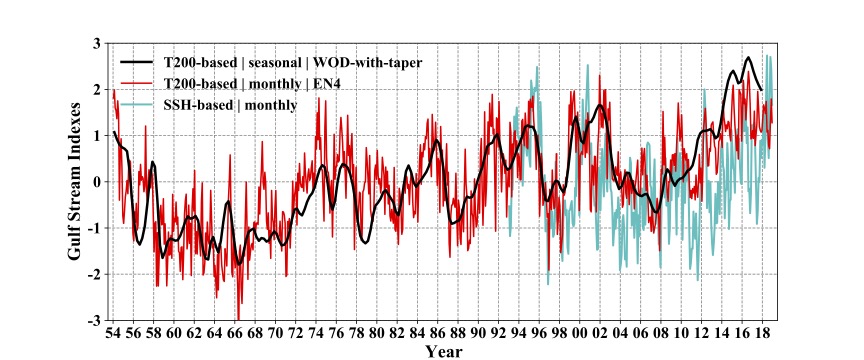
Figure. The time series of three Gulf Stream Indices (GSIs). The black line represents the seasonal subsurface T200-based GSI (1954-2017) calculated using the WOD data. The red line is the T200-based monthly GSI using the gridded EN4 data (1954-2018). The cyan line represents the SSH-based monthly GSI (1993-2018). Figure Source