Projects
Long-term SST Trends over the Northwest Atlantic Shelf & Slope
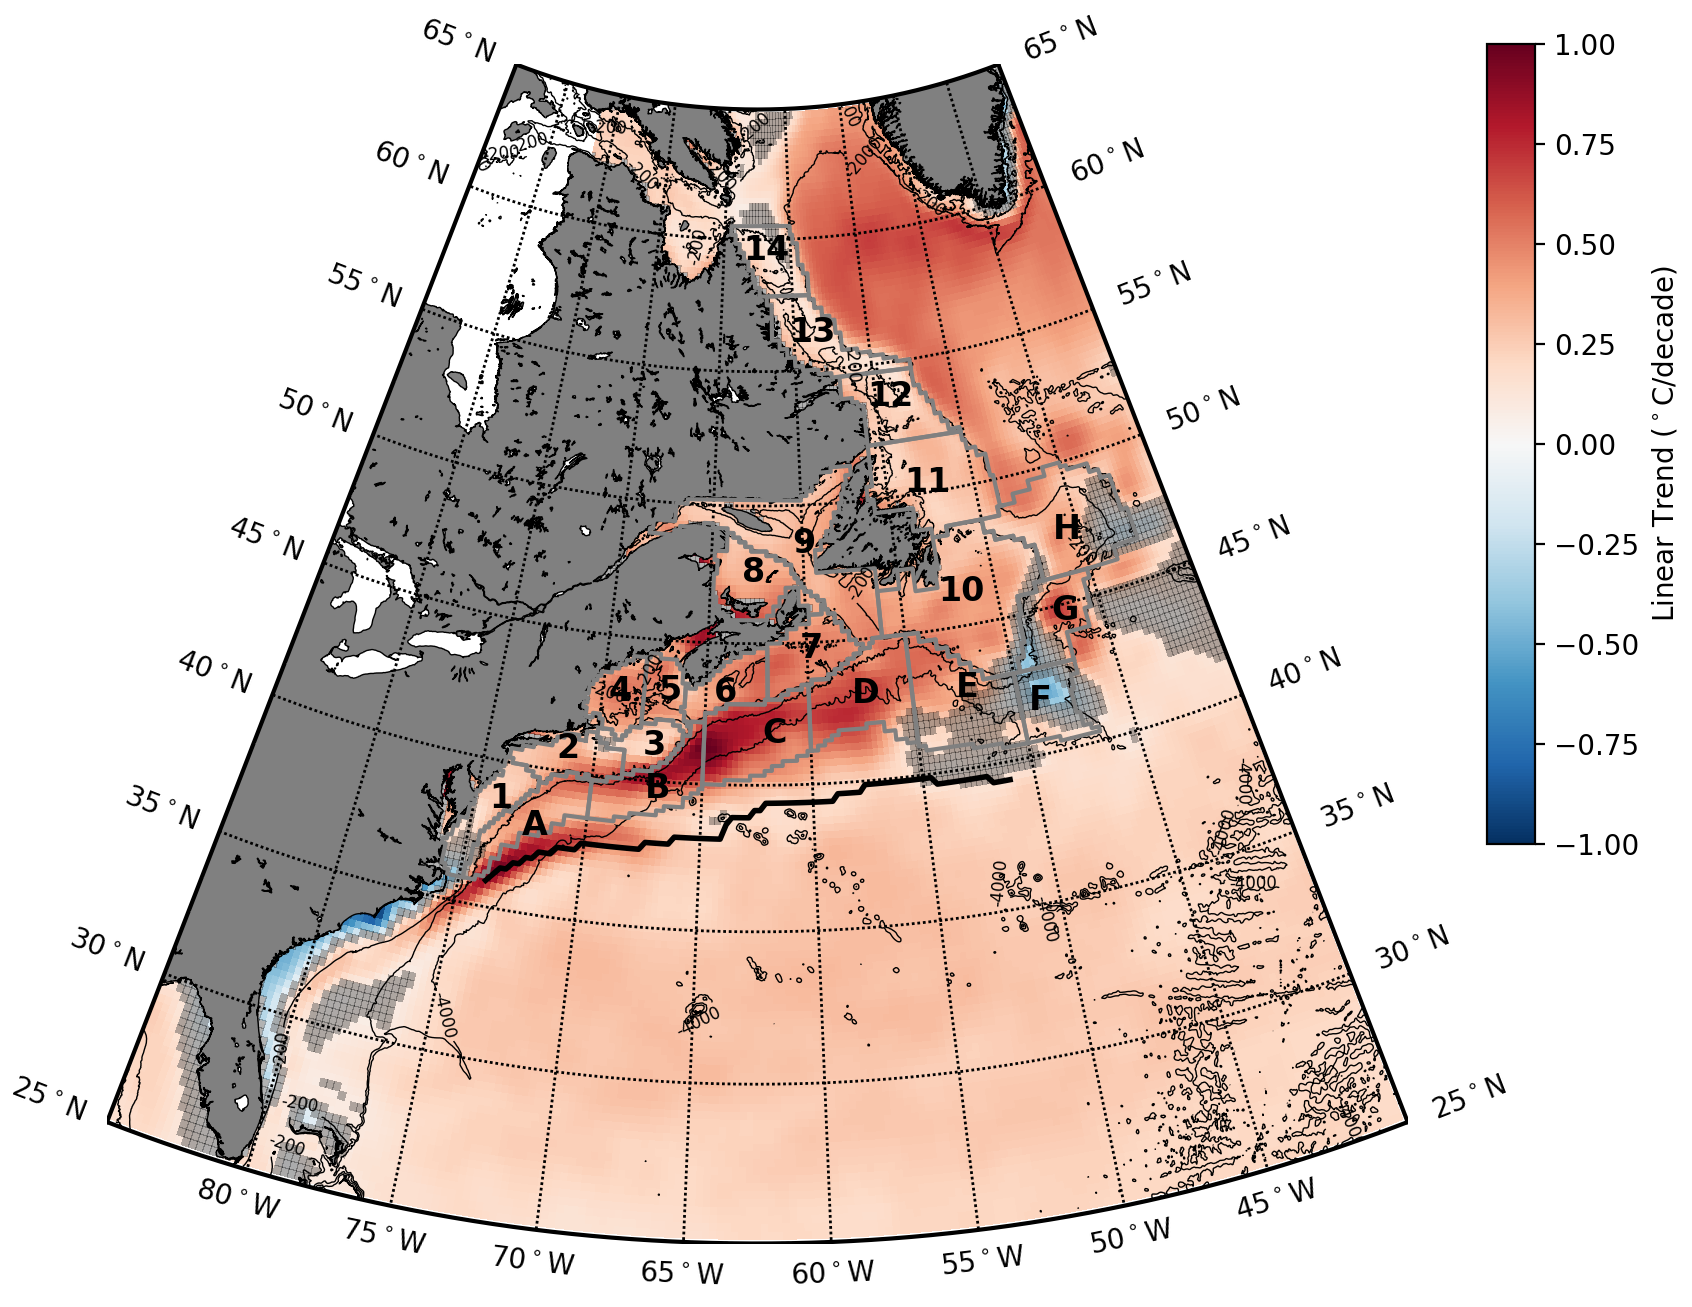
A meridionally concurrent large SST warming trend is identified as the dominant signal over the length of the continental shelf and slope between Cape Hatteras in North Carolina and Cape Chidley, Newfoundland and Labrador, Canada.
- The linear trends are 0.37 ± 0.06 and 0.39 ± 0.06 °C/decade for the shelf and slope regions, respectively.
- These meridionally averaged SST time series over the shelf and slope are consistent with each other and across multiple longer observational data sets with records dating back to 1900.
- The coherence between the long-term meridionally averaged time series over the shelf and slope and basin-wide averaged SST in the North Atlantic implies approximately two thirds of the warming trend during 1982–2018 may be attributed to natural climate variability and the rest to externally forced change including anthropogenic warming.
 Figure. Spatial pattern of linear trends of sea surface temperature anomaly between 1982 and 2018 based on the NOAA OISST. Insignificant values at 5% are masked in gray. The mean Gulf Stream path between 50° and 75°W is indicated by the black solid line. Figure Source
Check out the paper here›
Other Projects
- Projects · Projecting future changes in the Gulf Stream warm-core rings and their impacts on the Northeast U.S. Large Marine Ecosystem in a changing climate using regional MOM6 simulations
- Projects · Skillful multiyear prediction of marine habitat shifts jointly constrained by ocean temperature and dissolved oxygen
- Projects · Seasonal Prediction of Bottom Temperature on the Northeast U.S. Continental Shelf
- Projects · Interannual Variability of the Mid-Atlantic Bight Cold Pool
- Projects · Long-term SST Trends over the Northwest Atlantic Shelf & Slope
- Projects · Seasonal Variability of the Mid-Atlantic Bight Cold Pool